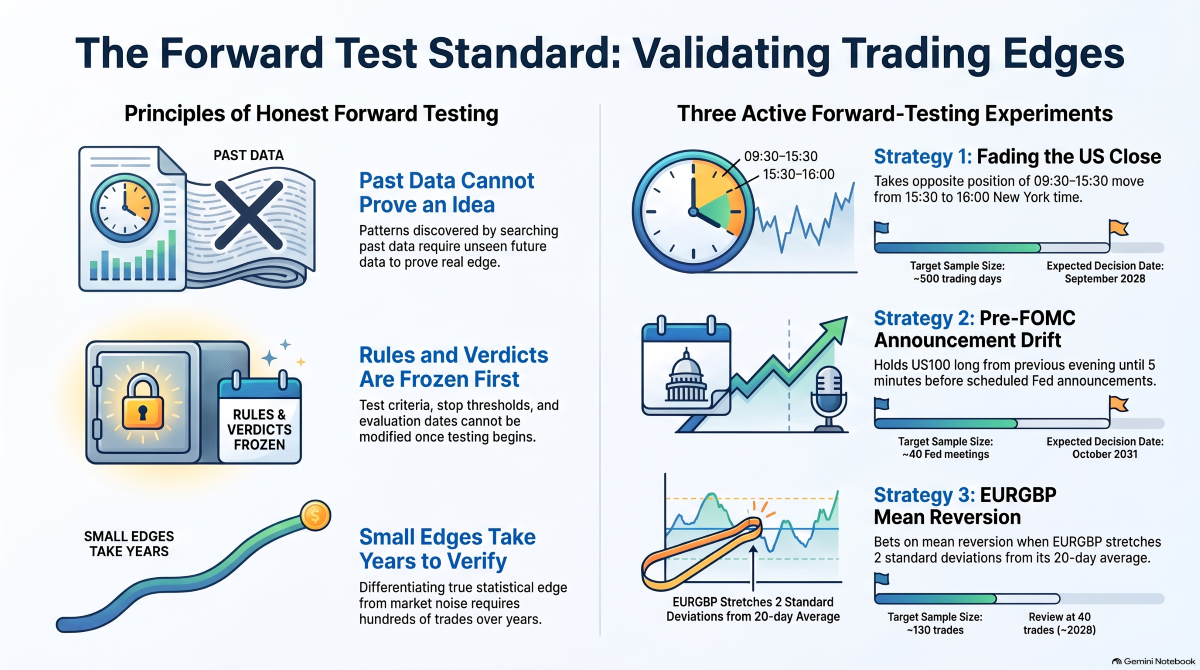
In October we tested sixteen trading ideas. None became a new proven EA. Three, though, left something behind: a result that looked real in our data but that we could not honestly call evidence, because we had found it by looking. This article is about those three, and about the only fair way to test an idea you found by looking: on data that did not exist when you wrote the rule down.
That is a forward test. The rule is frozen. So is the verdict: what counts as a pass, what counts as a failure, and when we will decide. Then we wait.
Why "found by looking" is a problem
Search enough combinations of pairs, hours and thresholds and some will look excellent purely by chance. If we test twenty ideas and keep the best one, its numbers are inflated by the selection, however good they look. We describe the general version of this in A Backtest Is Not Evidence. The fix is simple to state: the data that suggested an idea cannot also be the data that proves it. When there is no older data left to check against, the only clean data left is the future.
Why it takes years
All three ideas share one uncomfortable property: the edge, if it exists, is small compared with the day-to-day noise. A small edge needs many trades before it can be told apart from luck. Before starting, we calculated how long each test needs if the effect is exactly as strong as it looked:
| Test | Trades per year | Needed to reach t ≈ 2 (if real) | Decision date |
|---|---|---|---|
| Fade the move into the US close | ~250 | ~500 trading days | about September 2028 |
| US100 before Fed decisions | 8 | ~40 meetings | about October 2031 |
| EURGBP rubber band | ~14 | ~130 trades | reviewed at 40 trades, about 2029 |
Yes, that is a long time. It is also the honest answer. A seller would ship any of these the afternoon the backtest finished. We would rather wait than publish a number we cannot defend.
1. Fading the move into the US close
Where it came from. We tested a published effect: in the last half hour of the US stock market, prices tend to continue the day's direction, partly because leveraged ETFs must rebalance into the close. On the broker's US100 and US30 data it held in 2019-22, then reversed. Since 2023, trading against the day's move from 15:30 to 16:00 New York time made about 2.4 basis points a day on US100 (t 2.65) and 1.5 on US30 (t 2.41). One possible explanation is the growth of same-day options, whose dealers hedge against the move into the close. That explanation came after the fact, and so did the result.
The frozen rule. On every US trading day, at 15:30 New York time, take the opposite side of the move since the 09:30 open, and close at 16:00. One spread is charged per trade.
The verdict, decided in advance. Only days from 8 September 2026 count. At 250 days (about September 2027), if US100 is not making money, we stop. At 500 days (about September 2028), it passes only if US100 is profitable with t ≥ 2 and US30 is profitable too.
So far: 28 days, US100 +3.0 bp a day (t 1.0), US30 +0.9 (t 0.4). The right direction, and statistically meaningless at this sample size.
2. US100 in the hours before Fed decisions
Where it came from. A well-known 2015 study found that US stocks rose sharply in the day before scheduled Federal Reserve announcements between 1994 and 2011. On the S&P 500 we reproduced that: +30 bp on announcement days against +1 bp on other days (t 2.97). After 2012, measured the same way, it has mostly gone (t 0.53), and it is absent on the Dow. But measured more precisely at the broker, from the previous evening's close to five minutes before the 14:00 statement, US100 made +35.5 bp per meeting over 53 meetings in 2019-26 (t 2.50). That was not the test we had pre-registered, so it does not count as a pass.
The frozen rule. Long US100 from 16:00 New York time the day before a scheduled FOMC announcement to 13:55 on the day, net of one night's financing and the spread.
The verdict, decided in advance. Only meetings from 28 October 2026 count. At 16 meetings (about September 2028), if it is not making money, we stop. At 40 meetings (about October 2031), it passes if it is profitable with t ≥ 2. Eight meetings a year is the bottleneck. There is no faster honest way.
3. The EURGBP rubber band, with alarms
Where it came from. We tested whether closely related currencies drift back together when they stretch apart. Across three crosses it failed, but EURGBP on its own made +20.7 bp per trade over 232 trades in 2010-26 (t 2.67), positive in 13 of 17 years. Because we picked it after the combined test failed, we checked it on older data nobody had used: 2003-2009. There it earned nothing before costs, and in 2007-08, when sterling fell about 30% against the euro, it lost roughly 10%. So this is a regime edge: it worked in a decade when the two currencies happened to stay close.
The frozen rule. When EURGBP moves more than two standard deviations from its 20-day average, bet on it coming back. Exit when it does, or after ten days. We run it in two versions: as it is, and with a filter that skips new trades when volatility is extreme. The filter would have avoided most of 2008, but it would also have skipped good years, and we chose it after seeing 2008. That is exactly why it is only judged on new data.
The alarms. Instead of waiting years for a verdict, this test watches for the signs that it is breaking. Each threshold was measured from its own history:
| Alarm | Warning | Stop |
|---|---|---|
| Losing streak | 6 in a row | 7 in a row (a 1-in-100 event if the edge still holds) |
| Drawdown | −11.6% | −13.2% (worse than anything in 2010-26) |
| Single trade | a loss of 4.5% or more | — |
| Trend change | EURGBP moves more than 6.6% in 60 days, as in 2008 and 2016 | — |
| News | open positions are checked against scheduled Bank of England and ECB decisions | — |
A stop ends that version on the spot. Otherwise we review at 40 trades, around 2029. So far: two trades since 7 September 2026, −0.7% in total, no alarms.
The rules we hold ourselves to
- The rules and the verdicts were written down before the data. The documents are dated, and nothing in them changes.
- Monthly checks report but cannot pass a test early. Looking good after three months is not a result. Stopping when something looks good is the same mistake as picking the best backtest.
- A failure can end a test early. That asymmetry is deliberate.
- We will publish the outcome either way. If all three fail, that is the article.
What this means if you follow 1kPips
None of these three is running with real money, and none is on the presets page as a tradable preset. They are paper tests, run on the broker's data every month. The four presets we label proven are still the same four: the Tokyo fix on four yen pairs. If any of these three earns its way onto the site, you will see the forward record that got it there, not just the backtest. Our wider list of what we have tried, and what failed, lives in the research log. For why we publish failures at all, see How EA Sellers Make Money.
Nothing on this site is investment advice. Every figure above is a backtest, a measurement on one broker's data, or a paper result, published so that it can be checked.
Comments