Optimization is seductive.
You run an MT5 optimization, tweak a few parameters, and suddenly your profit factor jumps from 1.2 to 2.8. Equity curve looks smooth. Drawdown drops. Sharpe improves. You feel like you’ve found the holy grail.
Then you forward test it. And the system collapses.
Welcome to the difference between optimization and curve fitting.
In this article, we’ll break down how to perform EA optimization properly — choosing intelligent parameter ranges, avoiding curve fitting traps, and building systems that remain robust when markets shift.
Why Overfitting Destroys Most EAs
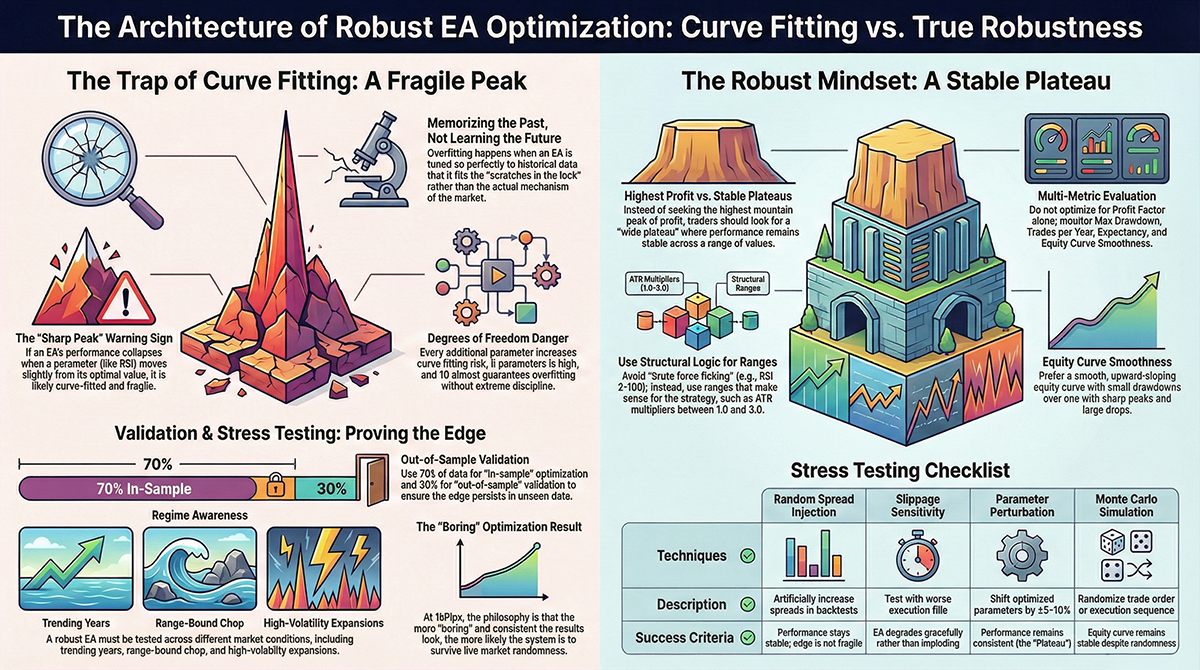
Overfitting happens when your EA becomes too perfectly tuned to historical data. It memorizes the past instead of understanding the structure behind it.
Think of it like fitting a key to scratches in the lock instead of the actual mechanism. It works once — then fails everywhere else.
In trading terms, overfitting usually means:
- Extremely narrow parameter “sweet spots”
- Performance collapses when values change slightly
- Great backtest, terrible forward test
- High trade frequency with unstable edge
The goal of optimization is not to maximize historical profit. The goal is to find stable regions of performance.
The Right Mindset for EA Optimization
If your objective is “highest profit factor,” you are already heading toward curve fitting.
A better objective:
- Wide profitable parameter zones
- Stable equity slopes
- Acceptable drawdown under different market regimes
- Consistency across time splits
Robustness beats peak performance. Every time.
Choosing Parameter Ranges the Smart Way
Most traders make the same mistake: they optimize over absurd ranges.
For example:
- RSI period: 2 to 100
- EMA fast: 5 to 200
- ATR multiplier: 0.1 to 10
This is not intelligent exploration. It’s brute force fishing.
Start With Structural Logic
Before running optimization, ask:
- What is the strategy trying to capture?
- What volatility regime does it target?
- Is it short-term noise or multi-hour swing?
Then define ranges that make structural sense.
Example:
- ATR multiplier between 1.0 and 3.0 (reasonable volatility stop width)
- RSI thresholds around pullback zones (e.g., 30–45 for buys)
- EMA fast slightly faster than EMA slow (avoid extreme gaps)
You want parameter ranges that reflect market logic — not randomness.
Flat Plateaus vs Sharp Peaks
This is one of the most important concepts in EA optimization.
Imagine you optimize RSI period from 10 to 30.
If only RSI = 17 works — and 16 or 18 collapse — that’s a sharp peak. It’s likely curve fitted.
If RSI between 14 and 22 all produce similar stable profit factors — that’s a plateau. That’s robustness.
You are not searching for the highest mountain peak. You are searching for a wide plateau.
Use Forward Testing Properly
MT5 allows forward optimization splits. Use them.
A simple framework:
- 70% in-sample optimization
- 30% out-of-sample validation
If your optimized parameters perform similarly in both segments, that’s a good sign. If forward performance collapses, you’ve likely curve fitted.
Even better:
- Optimize on Year 1–2
- Forward test on Year 3
- Roll window forward and repeat
Markets evolve. Your EA must survive different volatility regimes.
Multiple Metrics, Not Just Profit Factor
Many traders optimize for profit factor only. That’s dangerous.
You should monitor:
- Profit Factor
- Max Drawdown
- Trades per Year
- Expectancy per Trade
- Equity Curve Smoothness
A system with PF 1.8 and stable drawdown may outperform a PF 2.5 system that collapses under volatility spikes.
Regime Awareness During Optimization
Markets are not static.
- Low volatility compression periods
- High volatility expansion phases
- Trending environments
- Range-bound chop
When optimizing, test your EA across:
- Trending years
- Range years
- High-spread environments
If your strategy only works in one specific condition, it is not robust.
At 1kPips, we prefer systems that:
- Trade less
- Block aggressively during bad regimes
- Scale smoothly with volatility
The Danger of Too Many Parameters
Every parameter adds degrees of freedom. Every degree of freedom increases curve fitting risk.
Five parameters may already be too many. Ten almost guarantees overfitting unless you are extremely disciplined.
A clean architecture helps here:
- Strategy parameters control signal logic
- Engine parameters control execution policy
- Risk parameters stay independent
Separation reduces unintended interactions during optimization.
Robustness Testing Techniques
1. Random Spread Injection
Increase spread artificially in backtests. If performance collapses, the edge is fragile.
2. Slippage Sensitivity
Test with worse fills. A robust EA should degrade gracefully, not implode.
3. Slight Parameter Perturbation
Shift optimized parameters ±5–10%. If performance collapses, you were curve fitting.
4. Monte Carlo Simulation
Randomize trade order or execution sequence to test equity stability.
True robustness survives randomness.
What Optimization Should Actually Deliver
Optimization should give you:
- Confidence that your idea works broadly
- Understanding of sensitive parameters
- Clear regime boundaries
- Stable performance zones
It should not give you:
- Perfect equity curves
- Unrealistic profit spikes
- Overly precise parameter values
Parameter optimization is not about squeezing maximum profit from the past. It is about preparing your EA for the uncertainty of the future.
Curve fitting makes you feel smart. Robust optimization makes you profitable.
At 1kPips, we treat optimization as stress testing — not beautification. The more boring your optimization results look, the more likely they are to survive live markets.
Because in the end, markets do not reward perfect backtests. They reward systems that endure.
Comments