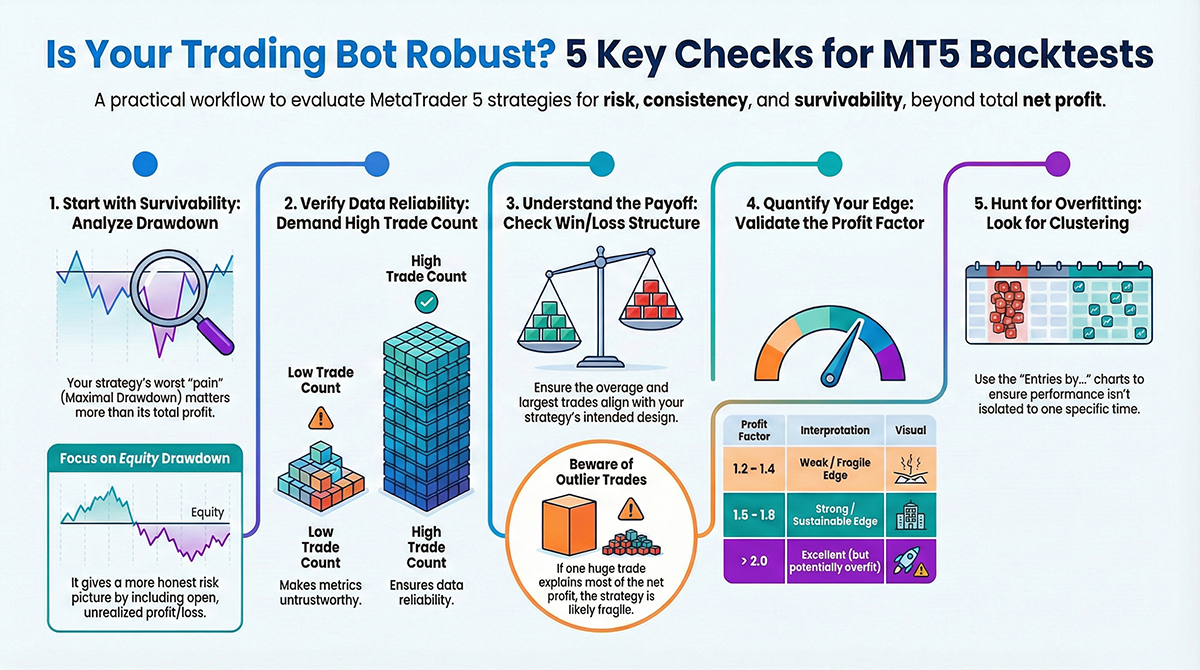
MetaTrader 5 (MT5) Strategy Tester produces a report full of metrics. Some are genuinely useful for evaluating an EA’s robustness, while others are easy to misread. Below is a practical, trader-focused explanation of the common fields shown in the MT5 backtest “Statistics” panel.
1) Profit and Loss Summary
Total Net Profit
The final net result of the test period. It is typically computed as Gross Profit − Gross Loss. This is the headline number, but it is not enough by itself because it ignores risk taken to earn it.
Gross Profit
The sum of profits from all winning trades. Useful when paired with Gross Loss to understand how the strategy “pays” and how it “bleeds.”
Gross Loss
The sum of losses from all losing trades (usually displayed as a negative number). This helps you judge whether the strategy relies on occasional large wins or on avoiding losses.
Expected Payoff
The average profit per trade: Total Net Profit ÷ Total Trades. A good sanity check, but only meaningful when trade count is large enough.
2) Edge and Quality Metrics
Profit Factor
A core “edge” metric: Profit Factor = Gross Profit ÷ |Gross Loss|.
- 1.0: breakeven (no edge)
- 1.2–1.4: weak to moderate (often fragile)
- 1.5–1.8: strong and commonly sustainable if not overfit
- > 2.0: excellent, but treat with suspicion if trade count is low or filters are heavy
Important: Profit Factor does not tell you the return rate. It tells you how efficiently profit is earned relative to loss.
Recovery Factor
A risk-adjusted performance metric: typically Total Net Profit ÷ Max Drawdown (exact formula can vary by report view). Higher is better because it means the strategy earns more per unit of drawdown pain.
Sharpe Ratio
A classic risk-adjusted return measure (returns relative to volatility). In MT5 reports, treat it as a comparative score rather than an absolute truth, because it depends on how returns are sampled. Higher is better, but an unusually high number can appear in short tests or with very smooth equity from low trade counts.
AHPR and GHPR
These are average growth measures per trade:
- AHPR (Arithmetic Holding Period Return): arithmetic average of per-trade returns.
- GHPR (Geometric Holding Period Return): geometric average (compounded) of per-trade returns.
If AHPR is noticeably higher than GHPR, it can indicate higher variability, which reduces compounding efficiency.
3) Drawdown and Risk Metrics
Balance Drawdown vs Equity Drawdown
MT5 reports drawdown in two ways:
- Balance Drawdown: based on closed trades only (balance changes when positions close).
- Equity Drawdown: includes floating P/L (open trade unrealized profit/loss).
For EAs that hold trades for any meaningful time, equity drawdown is usually the more honest risk picture.
Drawdown Absolute
The difference between the initial deposit and the minimum value reached during the test. This can be misleading if the account grows a lot, so also look at maximal and relative drawdowns.
Drawdown Maximal
The largest peak-to-trough drop observed during the test (in account currency). This is one of the most important risk fields because it represents the worst pain experienced.
Drawdown Relative
Maximal drawdown expressed as a percentage. This is often more comparable across tests and account sizes than currency drawdown.
Margin Level
A leverage / margin safety indicator (equity relative to used margin). Higher is safer. Very low margin level implies the system is trading too large and is vulnerable to volatility spikes and stop-outs.
Practical reading tip: if you are choosing a “how much risk can I hold” sizing rule, drawdown fields matter more than Total Net Profit.
4) Trade Count and Win/Loss Breakdown
Total Trades
The number of completed trades (positions) in the test. Low trade count makes all metrics less trustworthy. As a rough guideline, a few hundred trades is far more informative than a few dozen.
Total Deals
MT5 distinguishes “deals” (execution fills) from “trades” (positions). One trade can contain multiple deals due to partial fills, scaling, or broker execution mechanics.
Short Trades (won %), Long Trades (won %)
Win rate split by direction. Directional imbalance can reveal a hidden bias (for example, doing well only in long trades on a bullish regime).
Profit Trades (% of total) and Loss Trades (% of total)
The distribution of wins and losses. Win rate alone is not enough: combine this with average win/loss and Profit Factor.
5) Trade Size Distribution and Streak Risk
Largest profit trade / Largest loss trade
The biggest win and biggest loss. This quickly reveals if performance is dominated by a few outliers. If one or two trades explain most of the net profit, the strategy may be fragile.
Average profit trade / Average loss trade
Typical win size versus typical loss size. This is essential for understanding the strategy’s payoff structure (for example, small frequent wins vs bigger occasional wins).
Maximum consecutive wins ($) / Maximum consecutive losses ($)
The worst and best streaks measured in money. Consecutive loss streaks matter operationally because they drive drawdown and can trigger risk guards.
Maximal consecutive profit (count) / Maximal consecutive loss (count)
The longest streak of wins and losses, measured by number of trades. This helps you set realistic safety limits such as max consecutive losses and cooldown rules.
Average consecutive wins / Average consecutive losses
Typical streak behavior. Useful for setting expectations and sizing risk so normal streaks do not feel catastrophic.
6) Statistical Pattern Checks
Z-Score
A measure related to trade outcome streak patterns (whether wins/losses cluster more than randomness would suggest). Interpretation depends on sample size. Use it as a flag, not as a decision-maker.
LR Correlation and LR Standard Error
Linear regression (LR) metrics applied to the equity curve:
- LR Correlation: how well a straight line fits the equity curve progression (higher often means smoother trend).
- LR Standard Error: how much the curve deviates from that fitted line (lower often means smoother).
These can be helpful for comparing two versions of the same EA, but they can look “too good” in short tests.
OnTester result
A custom number returned by an EA’s OnTester() function for optimization ranking. This value is only meaningful if you know exactly what your code returns there.
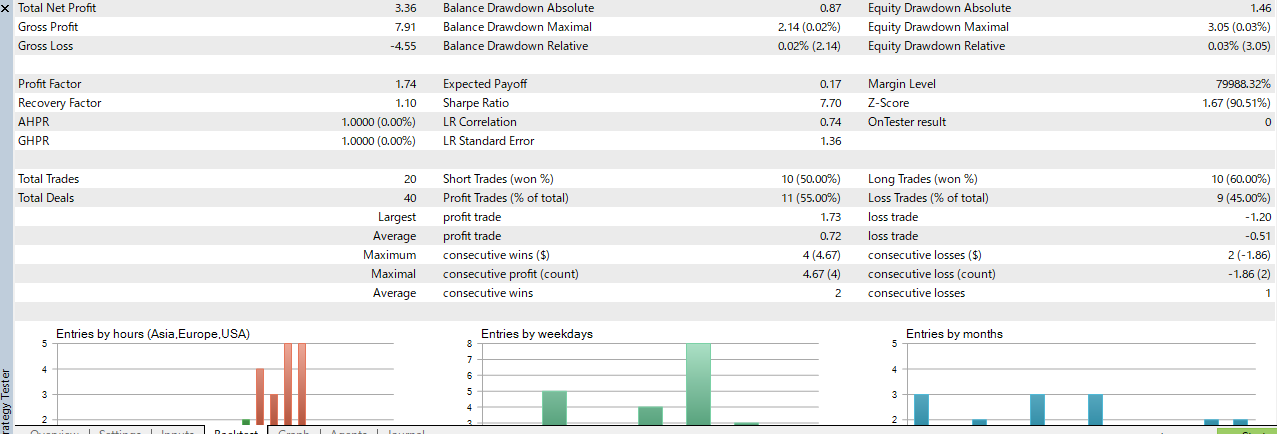
7) “Entries by …” Charts
Entries by hours (Asia, Europe, USA)
Shows when the EA is taking trades. This is important for session-aware systems. You want the distribution to match your intended session window and avoid accidental always-on behavior.
Entries by weekdays
Helps detect day-of-week dependency. If most trades occur on one weekday, performance may be regime-specific or data-specific.
Entries by months
Shows clustering across months. This is a quick way to detect “one good month” backtests. A robust EA tends to trade and perform across many months, not just one.
How to Read This Like a Robust EA Developer
- Start with drawdown: equity drawdown maximal and relative are your survivability anchor.
- Check trade count: low counts make everything unreliable.
- Confirm payoff structure: average win/loss and largest loss should make sense for your SL/TP design.
- Validate edge: Profit Factor around 1.5–1.8 can be excellent if stable across periods and symbols.
- Look for clustering: entries by hours/weekdays/months should not scream “overfit window.”
If you want a single robust evaluation habit, it is this: optimize for survivability first (drawdown), then for consistency (trade count and distribution), and only then for profit.
Comments