Bollinger Bands are one of the most popular indicators in trading.
They are also one of the most misused.
At 1kPips, we see this mistake constantly in EA logic and manual strategies alike:
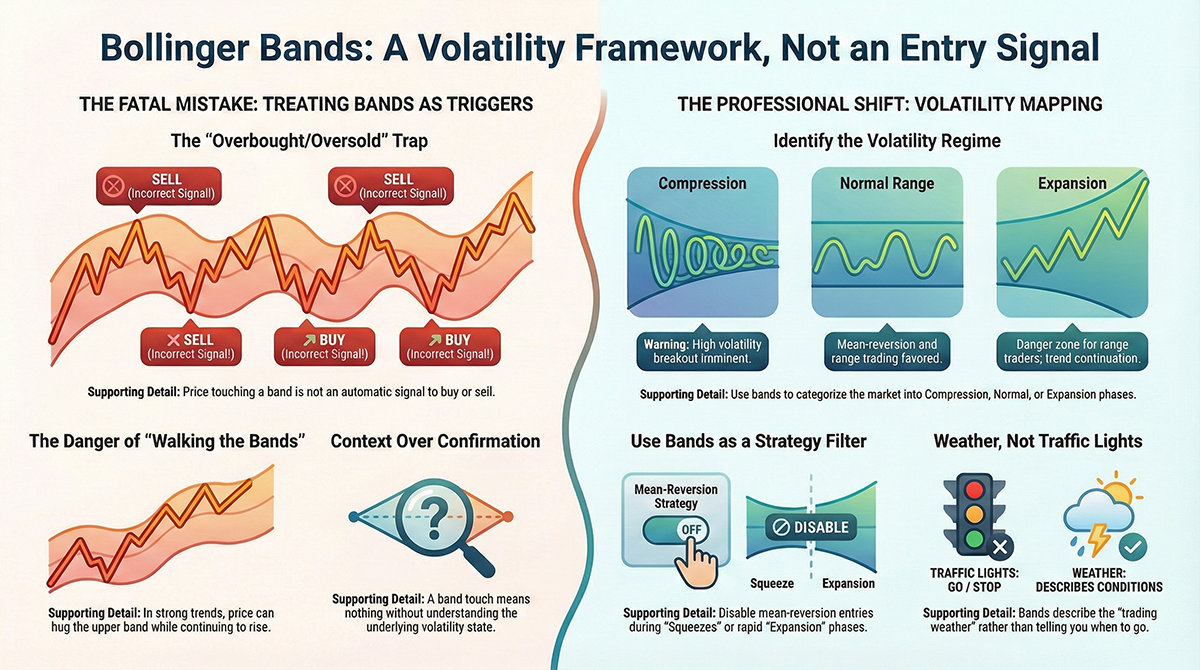
Price touched the upper band, so sell.
Price touched the lower band, so buy.
Sometimes it works. Often it doesn’t. And over time, this misunderstanding quietly kills performance.
Bollinger Bands were never meant to be a direct entry signal.
They were designed as a volatility framework.
This article explains how Bollinger Bands should be understood and used: not as a trigger, but as a tool to read volatility, detect ranges, and recognize expansion phases before they hurt your strategy.
What Bollinger Bands Were Actually Designed To Do
Bollinger Bands consist of:
- A moving average (usually 20-period)
- An upper band (standard deviation above)
- A lower band (standard deviation below)
The key component is not the bands themselves.
It is the standard deviation.
Bollinger Bands expand and contract based on volatility. That is their core purpose.
They answer the question:
“Is the market quiet, normal, or expanding?”
They do not answer:
“Should I buy or sell right now?”
The Biggest Mistake: Treating Bands as Overbought / Oversold
Many traders use Bollinger Bands like RSI:
- Upper band = overbought
- Lower band = oversold
This logic fails badly in trending or expanding markets.
In strong trends:
- Price can walk the upper band for hours
- Repeated “sell” signals get crushed
- Mean reversion logic breaks down
The band touch itself means very little without context.
Bollinger Bands as a Volatility Map
A more useful way to view Bollinger Bands is as a map of volatility states.
There are three primary regimes:
- Compression (low volatility)
- Normal range
- Expansion (high volatility)
Each regime favors different strategies.
Using Bollinger Bands correctly means identifying which regime you are in before thinking about entries.
The Bollinger Squeeze: When Nothing Is Happening
The famous Bollinger squeeze occurs when:
- Bands contract tightly
- Price movement becomes narrow
- Volatility drops below normal
This is not a signal to trade.
It is a warning:
“Something is about to change.”
In EA development, squeezes are useful for:
- Disabling mean-reversion entries
- Preparing breakout logic
- Reducing trade frequency
The mistake is entering inside the squeeze. The opportunity usually comes after it ends.
Volatility Expansion: The Danger Zone for Range Traders
When Bollinger Bands expand rapidly, volatility is increasing.
This is where many range-based EAs fail.
In expansion phases:
- Reversion takes longer
- Stops are hit more often
- Price ignores historical boundaries
Bollinger expansion is not a reason to fade price.
It is a reason to ask:
“Should my strategy even be active right now?”
Professional EAs often use Bollinger width or expansion rate as a trade filter, not an entry trigger.
Range Detection: Where Bollinger Bands Shine
Bollinger Bands are extremely effective at identifying range conditions when combined with other context:
- Low band width
- Stable midline
- Limited directional movement
In these conditions:
- Mean reversion works
- Targets are realistic
- Risk is more controllable
Notice the shift:
Bollinger Bands are not telling you where to enter.
They are telling you whether the environment supports your strategy.
Why Band Touches Can Mean Opposite Things
A band touch can mean:
- Exhaustion in a range
- Strength in a trend
The difference is volatility behavior.
If bands are flat and narrow, touches often revert.
If bands are expanding and angled, touches often continue.
This is why Bollinger Bands should never be used alone.
How EAs Should Use Bollinger Bands
In professional EA logic, Bollinger Bands are typically used to:
- Enable or disable strategies
- Adjust stop and target expectations
- Detect volatility regime shifts
They are rarely used as:
- Direct buy/sell triggers
- Standalone confirmation signals
This distinction is critical for long-term performance.
Common EA Mistakes with Bollinger Bands
- Entering immediately on band touch
- Ignoring band slope and width
- Using fixed targets regardless of volatility
- Combining Bollinger with conflicting indicators
These mistakes often pass backtests but fail live when volatility shifts.
A Better Mental Model
Think of Bollinger Bands as weather, not traffic lights.
They describe conditions.
Your strategy decides actions.
Trading against volatility is expensive. Trading with awareness of volatility is sustainable.
Indicators Don’t Trade, Context Does
Bollinger Bands are powerful because they are honest.
They expand when markets are dangerous and contract when markets are quiet.
They do not promise entries. They provide information.
At 1kPips, we treat Bollinger Bands as a foundation for understanding market behavior, not a shortcut to signals.
Use them as a volatility tool, and they will protect your strategy more often than they trigger it.
Comments