Bollinger Bands as a Volatility Tool, Not a Signal
Why touching the band is information, not an entry. Bollinger Bands are often taught as a simple visual signal: price hits the upper band, sell. price hits the lower band, buy. That logic feels intuitive. It is also one of the fastest ways to build an EA that overtrades and underperforms. For system traders, Bollinger Bands are not buy or sell signals. They are a volatility measurement framework. In this article, we break Bollinger Bands out of signal-chasing mode and explain how performance-focused EAs actually use them.
What Bollinger Bands Really Measure
Bollinger Bands are built from a moving average and standard deviation. That means they describe how far price is moving away from its recent mean.
In simple terms:
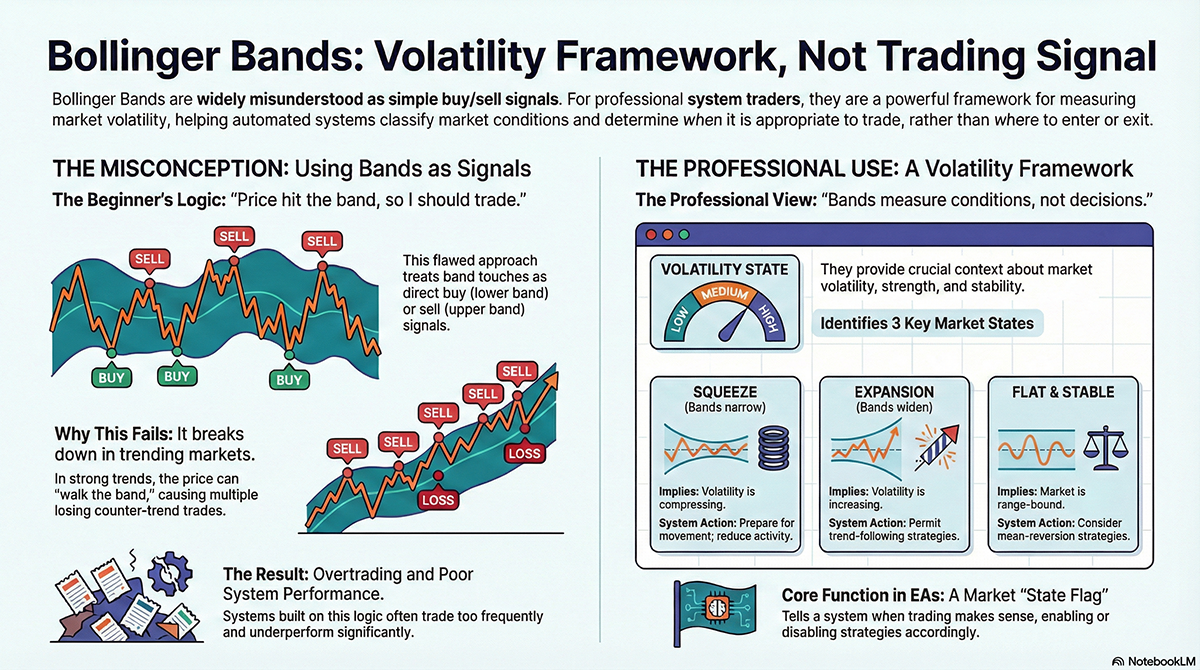
- Wide bands mean high volatility
- Narrow bands mean low volatility
- Expanding bands mean volatility is increasing
- Contracting bands mean volatility is compressing
Notice what is missing here. There is no instruction to buy or sell. Bollinger Bands describe conditions, not decisions.
Why Band Touch Signals Fail
Many beginner EAs assume price should revert when it touches a band. That assumption breaks immediately in trending markets. In strong trends, price can walk the band for hours or days. Every touch becomes a losing countertrend trade. Band touches do not mean reversal. They mean price is moving with strength relative to recent volatility.
The Bollinger Squeeze: Volatility Compression
One of the most valuable concepts in Bollinger Bands is the squeeze. A squeeze occurs when the bands contract tightly around price. Volatility drops. Energy builds. System traders do not trade the squeeze itself. They prepare for what comes next.
- Squeezes often precede volatility expansion
- Direction is unknown during the squeeze
- False breakouts are common
In EAs, squeezes are best used as a state flag, telling the system to switch behavior or reduce activity.
Volatility Expansion: When Systems Wake Up
Volatility expansion is where Bollinger Bands shine. When bands begin to widen rapidly, something has changed. The market is leaving balance and entering movement.
Professional EAs often use:
- Band width increase as a breakout filter
- Expansion confirmation before trend entries
- Volatility thresholds to enable or disable strategies
Bollinger Bands do not tell you where to enter. They tell you when the market is capable of moving.
Range Detection with Bollinger Bands
Not all markets trend. Many spend most of their time ranging.
Bollinger Bands are excellent for identifying those environments.
- Flat middle band suggests mean stability
- Consistent band width suggests balanced volatility
- Repeated rejections near bands suggest range behavior
In range conditions, mean reversion strategies can work. In expansion conditions, they fail. Bollinger Bands help EAs choose which logic to activate.
How Professional EAs Use Bollinger Bands
In real trading systems, Bollinger Bands are rarely visible on charts. They operate silently as part of market classification.
Common EA uses include:
- Volatility regime detection
- Entry permission based on expansion
- Trade suppression during compression
- Adaptive stop sizing based on band width
Bollinger Bands do not generate trades. They decide when trading makes sense.
Memo
- Bollinger Bands measure volatility, not direction
- Band touches are context, not signals
- Squeezes signal compression, not entry
- Volatility expansion enables trend strategies
If your EA buys every lower band touch, you are fighting volatility. If it waits for volatility to justify risk, you are trading like a system designer.
Comments